 VacationSage
The year at a glance
ExcellentGoodFairPoor Click a month to compare destinations.
The short answer
Go in June–September. The least comfortable stretch is January–March.
- Warmest month: January, average high 32°C (90°F).
- Coolest month: July, average high 27°C (81°F), lows near 16°C (60°F).
- Wettest month: March, about 156 mm (6.1 in) of rain.
- Driest month: August, about 33 mm (1.3 in).
Quick facts
- Currency
- Brazilian real
- Language
- Brazilian Sign Language, Portuguese
- Plugs
- Type C, Type N
- Drives on the
- right
- Calling code
- +55
- Airports
- Rio de Janeiro/Galeão – Antonio Carlos Jobim International Airport (GIG)
Santos Dumont Airport (SDU)
Jacarepaguá Airport (RRJ) - Population
- 6,730,729
Temperature and rain through the year
Average highAverage lowRain (mm, right axis)
Top sights in Rio de Janeiro
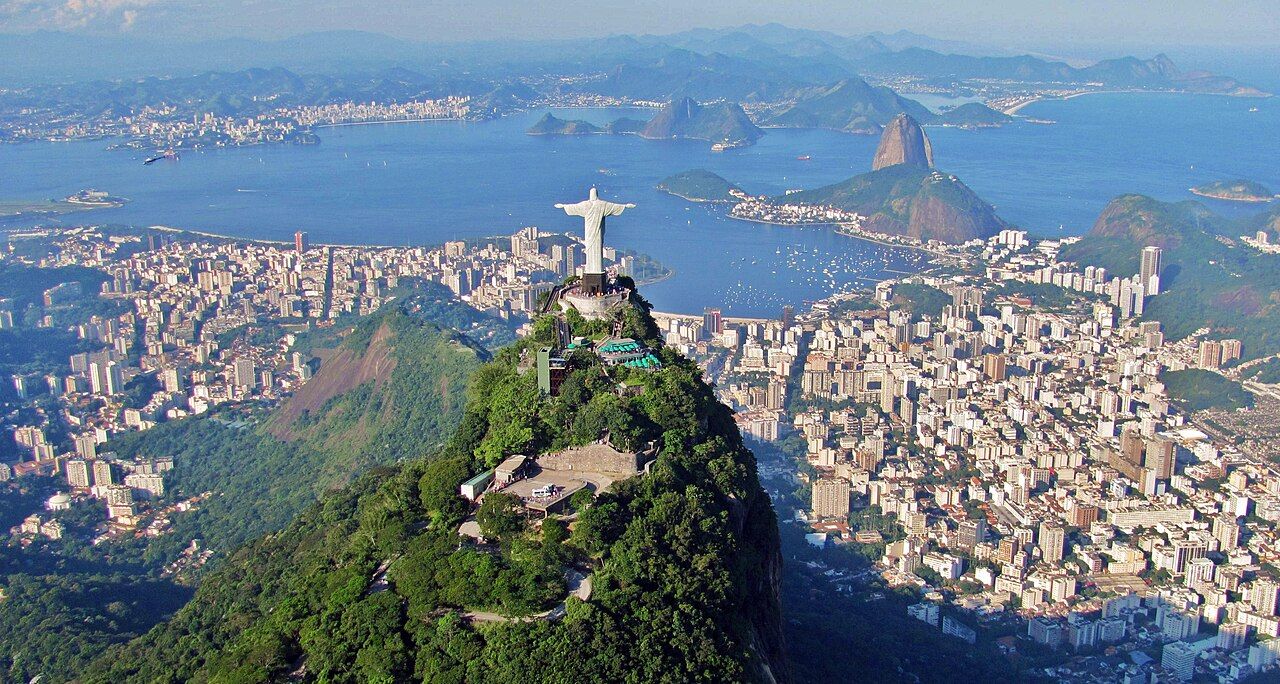
- Christ the Redeemer colossal statue of Jesus in Rio de Janeiro, Brazil
- Sugarloaf Mountain peak situated in Rio de Janeiro, Brazil
- Corcovado mountain in Rio de Janeiro, Brazil, known for the Christ Statue
- National Library of Brazil Brazilian national library
- Valongo Wharf former wharf in Rio de Janeiro
- Rio de Janeiro Cathedral cathedral in Rio de Janeiro, Brazil
- Lagoa Rodrigo de Freitas Lagoon Rodrigo de Freitas in Rio de Janeiro, Brazil
- Ginásio do Maracanãzinho indoor arena in São Cristóvão, Rio de Janeiro, Brazil
Ranked by how widely each place is covered across Wikipedia's language editions, a rough measure of fame rather than a recommendation.
UNESCO World Heritage nearby
- Valongo Wharf
- Sítio Roberto Burle Marx
- Tijuca Forest
- Rio de Janeiro: Carioca Landscapes between the Mountain and the Sea
Travel advisories
United States
Level 2 Exercise Increased Caution
Read the full advisory at travel.state.gov
Checked 2026-11-02.
United Kingdom
- The FCDO advises against all but essential travel to parts of the country.
Latest change (2026-10-28): Removal of information about elections ('Warnings and insurance' and 'Safety and security' pages).
Checked 2026-11-02.
Advisories are summarised from official sources and can change quickly; always read the source before you travel.
Month by month
| Month | Score | High | Low | Rain | Cloud | Dew point | Daylight |
|---|---|---|---|---|---|---|---|
| January | 3.8 Poor | 32°C 90°F | 21°C 70°F | 145 mm 5.7 in | 48% | 22°C72°F oppressive | 13.3 h |
| February | 4.0 Poor | 32°C 90°F | 21°C 71°F | 139 mm 5.5 in | 41% | 22°C72°F oppressive | 12.8 h |
| March | 4.9 Poor | 31°C 88°F | 21°C 70°F | 156 mm 6.1 in | 38% | 22°C71°F oppressive | 12.2 h |
| April | 6.7 Good | 30°C 86°F | 20°C 68°F | 104 mm 4.1 in | 31% | 20°C69°F muggy | 11.5 h |
| May | 8.2 Excellent | 28°C 82°F | 18°C 64°F | 86 mm 3.4 in | 32% | 18°C65°F muggy | 10.9 h |
| June | 9.7 Excellent | 28°C 82°F | 16°C 61°F | 49 mm 1.9 in | 29% | 18°C64°F sticky | 10.6 h |
| July | 9.7 Excellent | 27°C 81°F | 16°C 60°F | 48 mm 1.9 in | 30% | 17°C62°F sticky | 10.7 h |
| August | 9.9 Excellent | 28°C 82°F | 16°C 61°F | 33 mm 1.3 in | 30% | 17°C62°F sticky | 11.2 h |
| September | 9.7 Excellent | 28°C 83°F | 17°C 63°F | 44 mm 1.7 in | 41% | 18°C64°F sticky | 11.9 h |
| October | 8.3 Excellent | 29°C 84°F | 18°C 65°F | 71 mm 2.8 in | 45% | 19°C66°F muggy | 12.5 h |
| November | 7.1 Good | 29°C 85°F | 19°C 67°F | 90 mm 3.6 in | 46% | 20°C69°F muggy | 13.1 h |
| December | 5.5 Fair | 30°C 87°F | 21°C 70°F | 127 mm 5.0 in | 49% | 22°C71°F oppressive | 13.4 h |
Public holidays in the next 12 months
Holidays can mean closures, festivals and busier transport. National public holidays for Brazil; school holidays are not included.
- November 2026
- Finados
- Proclamação da República
- Dia Nacional de Zumbi e da Consciência Negra
- December 2026
- Natal
- January 2027
- Confraternização Universal
- March 2027
- Sexta-feira Santa
- April 2027
- Tiradentes
- May 2027
- Dia do Trabalhador
- September 2027
- Independência do Brasil
- October 2027
- Nossa Senhora Aparecida
More in Americas


Temperature, rain and dew point are 1991–2020 averages from a ~4 km climate grid; cloud cover is a 1981–2010 average. Recent years run warmer in most places, and a single trip can differ a lot. How this is calculated.